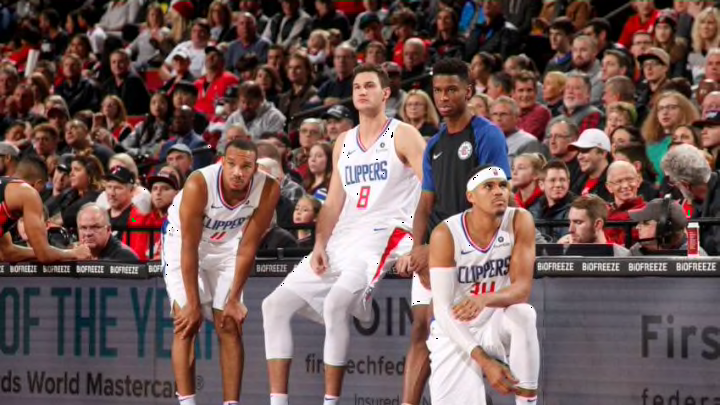
We divide the LA Clippers roster up by efficiency to highlight who’s been great, and who’s been slacking more so than not.
“Basketball isn’t played on a spreadsheet.” That’s a common refrain heard when discussing advanced statistics in the NBA. To an extent, this is true; just because Player A has the best Points-Times-Assists-Divided-By-Vowels-In-His-Last-Name in the league doesn’t mean anything.
That said, players can’t just be judged by the “eye test,” either. Sometimes the best way to understand a player’s impact is through the numbers. This is especially true when it comes to efficiency-related stats.
There are a few metrics I want to focus on today: Usage Percentage, True Shooting Percentage and Net Rating. I’ll give a quick rundown here of what these mean if you’re unfamiliar, and there’s also this excellent glossary from Basketball-Reference if you want exact formulae or just a reference.
Usage Percentage (USG%) is an estimate of the number of possessions a given player ends with a basket, a trip to the free throw line or a turnover. True Shooting Percentage (TS%) is a bit of an updated field goal percentage that tells you how efficiently a player is scoring. It accounts for trips to the free throw line, and it also accounts for the fact that shooting 50 percent from three is worth more than shooting 50 percent from two. There’s often an inverse relationship between these two stats; it’s much easier to be very efficient when you pick your spots and your usage is lower.
Finally, Net Rating is a measure of a player’s impact on the scoreboard. It looks at how well the player’s team scores while he’s on the court, and subtracts how well the opponent scores. The higher the better with this stat, and you don’t like to see a negative number. In terms you’ll find in the above Basketball-Reference glossary, this is ORTG minus DRTG.
One final stat I’ll mention when it’s relevant is Assist Percentage (AST%). This estimates the percentage of the team’s baskets a player assists on while he’s on the floor. This isn’t relevant for all players; who cares if a player like Montrezl Harrell isn’t racking up the assists, right?
Ok, all that said, let’s take a look at which Clippers players are playing efficiently, and which are less so. Then I’ll talk a bit about how our rookies stack up with rookies around the league. All stats are from the excellent NBA Stats.
